An introduction to rtsetse, a detailed population simulation in R
In this post I introduce R code to simulate tsetse fly populations I’m developing for the Liverpool School for Tropical Medicine starting in 2014. I will outline some background and point you to the code and user interface that are under development. In subsequent posts I’ll cover particular aspects of implementation.
African sleeping sickness is a serious disease caused by a trypanosome parasite transmitted by tsetse flies. Tsetse flies are themselves interesting as they feed entirely on blood, don’t have aquatic larvae and females produce a small number of larvae one at a time. Three common options for controlling tsetse flies and the disease are aerial spraying, treating cattle with insecticides and putting out small baited traps (somewhat like a handkerchief).
Glyn Vale and Steve Torr have lead the development of baits for controlling tsetse flies. Over the past 10 years they have developed a series of Excel based decision tools for tsetse control. Now the Bill & Melinda Gates Foundation are funding the update of one of these tools in collaboration with Mike Lehane and Ian Hastings at LSTM.
I was tasked with creating a spatial, age and sex structured simulation of tsetse fly populations in R based upon Hat-trick, the most recent and detailed of these Excel tools. Hat-Trick consists of around 10 Excel workbooks linked by VBA code. Some workbooks have tens of worksheets and the longest sheet has 20,000 rows. Hat-trick steps the user through a series of detailed modelling steps with plenty of documentation. The amount of detail inevitably makes the model very complicated. The aim of developing the replacement in R was to develop something that was more robust, transparent and reproducible.
We split the task in two.
- Population simulation
- User interface(s)
This separation allows for analyses run from the user interface also to be run from the R command line.
1. Population simulation - rtsetse
The tsetse population simulation is being developed as a series of modular functions grouped into an R package called rtsetse. There are, for example, separate functions for births, deaths and movement. Population simulations are run by other, longer functions that call these modules. This modular design allows the program to follow the mechanisms represented in the existing Excel model while allowing alternative representations to be incorporated at a later date. The source code for rtsetse is on Github.
2. User interface(s) - shinytse
User interfaces for the simulation are being developed in the wonderful shiny. These have the advantage that they can be run over the web or locally from R (useful where potential users in Africa may have limited connectivity).
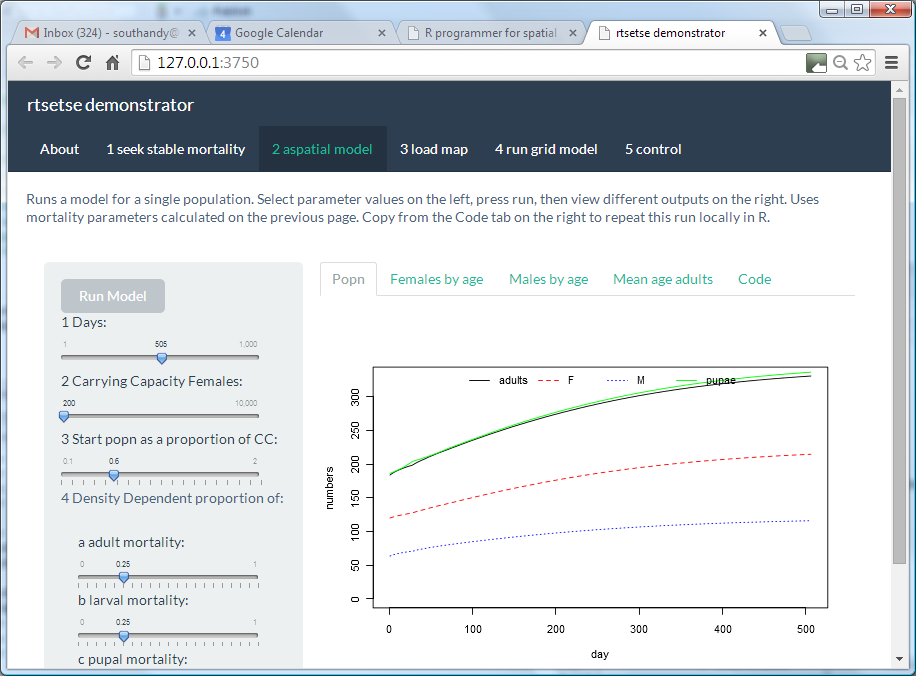
A user interface under development can be accessed online, a screenshot is shown below.

User interfaces are being structured as a series of shiny navbarPage objects which produce the menu across the top and allow users to step between different stages of the simulation. A simple off-the-shelf css file controls the appearance of the user interface.
The source for the user interfaces is on Github.
In subsequent posts I’ll outline development decisions being made in producing this tool. Feedback is welcome.
